/*************************************************************************************************
* These are some of the projects I have worked on my own time and in class.
*
* POV/Wheel Of Death
* Wireless Mesh Sensor Network
* Android Game
* IR Distance Sensor 3D Imager
*************************************************************************************************/
POV/Wheel Of Death
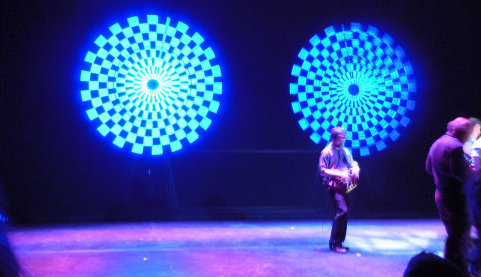
 The POV in POV/Wheel Of Death stands for persistance of vision. The intention of this project was the create a large, spinning shaft of lights to create a large area in which images and designs could be represented. This project was for a ECE/Theater art crossover class and was used during a music performance. Additional members who contributed to the project are Mitch Gallagher, Katherine Stoll, Karrie Jones, Ikaika Bostwick, Michelle Korte, Sean Benjamin, & Carson Scott.
When designing the POV it was necessary to define some requirements of functionality. The POV was decided to have three basic requirements. Firstly the PV would need to have each cell on the shaft accessible. This means that a single cell could be change from on to off. Secondly, the shaft would need to be at a dense enough resolution that shapes and designs would be distinguishable from the view of the audience. Thirdly, the resolution (spacing and radial resolution) needed to be dense enough that an image could be represented on it. The POV has more complex implications because of the nature of the POV. Because the device is spinning, the shaft containing the light would need to be updated every few degrees (radial resolution) to represent the greater image. Thus if the POV was being updated at twenty rotations per second, and the blade was updated every 2 degrees (180 times a rotation), then the individual lights would have to be capable of being changed 3600 times a second. In addition the POV was expected to be able to be turned on and off remotely, over a wireless signal.
The two projects are composed of three different pieces of software:
- Code running on the POV controller
- Code wirelessly controlling POV
- Code used to convert images/video to the controllers
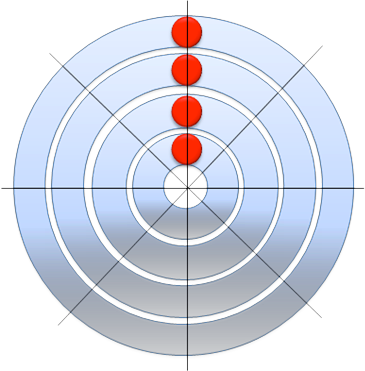
 It is important to explain how the code represents a design in memory. Basically, there is an array which as a width the size of the number of lights on the blade and a depth as long as the radial resolution. In each cell of the array there is a sing bit, which represents whether the light is on or off. Consider the diagram. The blue rings represent the path that the red lights will take on a rotation. The black lines are the positions were the lights should change if necessary. With eight positions, and four lights, any pattern can be held in an array that is 8 by 4 bits.
The POV code itself was writing for a PIC32, specifically the PIC32MX460. The code was written and compiled in MPLab as provided by Microchip Inc. The code’s primary functionality is provided by two timer interrupts. A timer interrupt is basically a function that is called after a period of time and performs some function.
The most important timer is actually used as a clock. The PIC does not have an onboard clock that could be used to time events. Instead, there was a timer interrupt that was created that would go off every 16us (microseconds). Every time the timer would go off, the code would check if the rotation sensor was triggered (the blade as at the known sensor position) and it would see how long it took from the last time it was at the position. That time is used to determine the speed at which the lights need to be updated on the blade, and that will be explained later. In addition, if the sensor is high, it is known that the blade is at a certain angle. The code will update the position it thinks it is at with the position it now knows it is at. Also, because it now knows how long it took to complete the last rotation, it can update the other timer.
The other timer is used to change what lights are on. It should be triggered 180 times per rotation as that is the radial resolution of the POV. Whenever the 16us timer finds a new rotation time value, its updates the other timer so that it knows to set its time to the rotation time divided by 180. It then sets the lights on the blade to whatever they should be according to the pattern that the POV is showing.
Because the patterns and routines on the POV should be reprogrammable, the patterns are stored in a header file named ‘patterns.h’. The header file declares the arrays, then updates a function called ‘getSequence(long pattern ,int angle)’. The getSequence function takes in two variables, a pattern identifier and the current angle. The pattern identifier is found by looking at the pattern queue stored in the patterns.h file. The queue is a list of patterns and how long they should be displayed. By looking at the time the program has been running, it is able to determine the correct pattern. The angle is being tracked in the timer. The function returns a value that is 64 bits long, one bit for every light. The lights on the blade are set to the value as found by the function.
The wireless portion of the POV is taken care of by a Xbee module communicating with a computer. For the first iteration of the project, it was desired that there would just be a few simple commands; start, stop, and reset. When the Xbee would receive data, it would send it to the PIC and if it was one of these commands, it would act accordingly. Due to issues with the UART2 functionality of the PIC, wireless was never fully realized.
Your browser may not support display of this image. The computer side of the wireless transmission would be taken care of by using any software that can communicate over serial to the Xbee transmitter. A possible software solution could be X-CTU, which is made by Digi, the same company that makes the Xbee. By having the PIC look for commands in the form of words or letters, and by sending words or letters by X-CTU to the PIC, it would be possible to make them take commands.
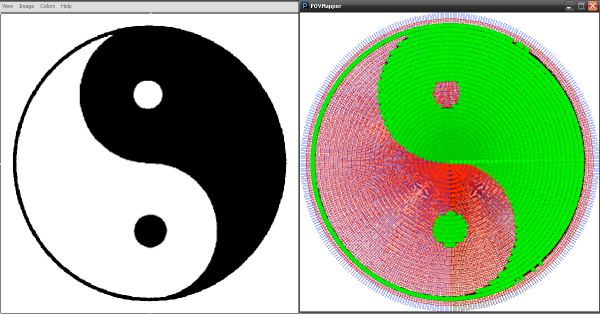
 Finally the software used to generate patterns was written in an open source IDE and language called Processing. The processing code looks for an image file and then checks all the locations where lights would be at a certain angle. The diagram shows the output of the program. On the left there is the original image, and on the right there is the output. Every green dot is a light that should be on at the angle shown. The red and blue lines show the separation of lines and columns.
These patterns would be copied into the patterns.h file and uploaded to the PIC.
The final release of the POV project, or at least the version used turning the performance had some issues, and did not meet all the function requirements. First, the wireless did not work. Because of this, the queuing of patterns could not be time to the start of the show. All the lights and updating worked fine, but it was unwieldy to use the pattern creator software. There was a significant effort to write software that would convert a video, as discuss in this document and auto generate the whole patterns.h file. This did not get fully realized due to time constraints.
Monster Party! an Android Game
 This game was created in collaboration with Robert Kubo, Andrew Bozzi, and Kyle Hasten for ECE473. The game is an augmented reality concept game which we hope will evolve into something greater. The story of the game is that you are having a biggest party ever, after which all your monster friends got lost, and it is up to you to find them. Essentially, the player has his real GPS coordinance shown on a map and the zones in which your friends can be found is indicated. Once you enter the zone an encounter occurs, and you can choose to capture the monster or run a way.
On the current iteration of the project, the capture event is rather simple. Basically, the camera starts and the monster takes a random position around you. You can pan the camera around, and when the camera is facing the right direction, you will see the monster. Then you take a picture of it to capture it. The monster will then show up in your inventory so you can rename or release it again.
Wireless Mesh Sensor Network
This project was sponsored by Professor Marcellin and Xin of the University of Arizona. It was built as a senior capstone by myself, as well as Austin Scheidemantel (EE), Ibrahim Alnasser (EE), Benjamin Carpenter (EE), Paul Frost (CE), Shivhan Nettles (SE), Chelsie Morales (SE). Some the following text was written by them as well for our final write up. The project itself is designed to be a platform on which applications could be designed to utilize as distributed wireless network using a mesh topology. A mesh allows all the nodes to route and communicate inter-dependantly, as well as allow the network to expand and heal itself. The platform can host sensors and report their data to a central node. This could be used for a variety of applications.
The initial design of the application is intended to perform a few required functions. Wireless communication and sensory data collection will be used to augment situational awareness of personnel in tactical situations. The situational awareness wireless network will implement commercial off-the-shelf sensors and wireless modules within a dense urban area. GPS and heart rate sensors will be used to collect situational data within the defined area. A wireless network utilizing a mesh topology will allow non-line-of-sight communication between all nodes and a base-station. The telemetry will then be transmitted to the base-station to allow for visual display and data logging.
The result was comprised of two types of modules. The first of which was a portable, battery powered unit that contained a wireless network device, microprocessor, and a series of sensors. This module is called a node and is to be worn by an individual. Though this node is able to support many sensors, there are a minimum of two in order to illustrate data collection. The first sensor was the GPS device that detected the node’s current geographical position. The second sensor on the module was a heart rate monitor that determined the wearer’s current heart rate. In the module, the microprocessor collected the data from the sensors, constructed a data packet to send and then sent the data to the base-station. The wireless node had two primary functions. The functions were to maintain a mesh network with all other modules and to send and receive data to and from specific modules on the network. The mesh network was in existence so that data could be conveyed to any module on the network without maintaining direct line-of-sight. This was achieved by allowing other modules to pass data around within the mesh so that it was received by the base-station using the addressing of the modules.
 The other device was a slightly larger less mobile unit called the base-station. This device
consists of a computer (laptop/PC/netbook) and the same wireless module used in the other
network modules. As data from the nodes was transmitted to the base-station via the wireless
transmitter, special software running on the computer interpreted the data and presented it to an
end user. The software then logged the data and allowed for the possibility that the data could be
viewed at a later time.
Besides this, many different devices of each component were examined and compared. This
included three different variants of microcontrollers, GPS modules, wireless modules, and heart
rate monitors. Being that all components were off the shelf, they were all comparable in
performance and quality.
Two sensors were selected for the nodes, a GPS module and a heart rate sensor. The particular GPS module selected was chosen for its small package size and robustness. The device used was from Vincotech and had a fairly strong antenna pre-built on the module, which reduced size and cost. The heart sensor was purchased from Polar as they offered an off the self sensor as well as a OEM IC for interfacing with it.
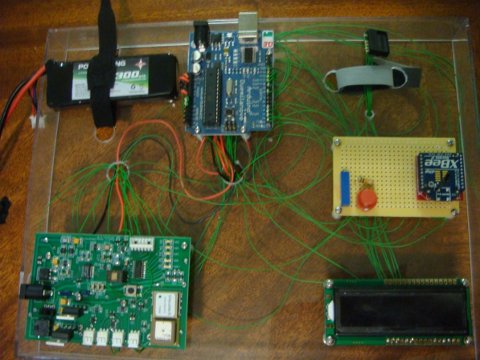
The microcontroller utilized for the nodes was an Atmel 368 running a custom runtime language provided by the Arduino open source project. The microcontroller interpreted the sensory data and packaged it for transmission. In addition the microcontroller interfaced with a small display on the device to show important troubleshooting information. These devices where joined using a custom printed circuit board (PCB) and were contained in a single package. Though for the prototype, they are not mounted as compactly as possible. Figure 1 displays the final prototype of the node mounted on acrylic.
The base-station device did not require as much hardware design as the node counterpart. The hardware was essentially limited to a single Xbee device, while all other functionality was provided by software that was running on the computer hosting the Xbee device. The software had the duty to record all data that was sent to the base-station from the nodes via the Xbee wireless module. Once the data had been logged, the software interpreted the data and presented it to the user so that it is graphical and easy to understand. The software allowed the user to decide which nodes to monitor and to personalize the nodes with information such as occupant name, rank, etc. In addition it can retrieve and ‘replay’ old data that has been previously logged. The figure shows the basic model that the software utilized.
The final design required the creation of unique software for the base-station component. The software had the duty of recording all data sent to the base-station from the nodes via the Xbee wireless module. Once the data has been logged, the software interpreted the data and presented it to the user. The software displayed all the incoming data, grouped into labeled sections by Xbee address. The node’s position was displayed on a map obtained via Google Maps.
The model portion of the software handled the majority of back-end operations, primarily the interaction with the wireless module. The USB/RS232 data interpretation was completed with the Serial Monitor Thread. This thread ran behind the program, monitoring the serial port for incoming data. As data came in, the monitor would determine the source of the data, and inform the model of the new data. The model portion would check the new Packet object for its source, and then update the Device/User object with the new information. The model would then update the various GUI view portions. These portions included a map, which would be updated when data containing GPS coordinates was received. In addition, the GPS data, along with any heart rate data, was displayed on the GUI in text form. The raw data was also displayed in a terminal, with the source indicated.
 The GUI itself allowed for configuration of the model, in that it would select the serial port to
which the Xbee was attached. The map portion was completely interactive, and contained zoom
and pan functionality.
An addition aspect of the design that was part of the software modeling was the structure of the
data packet frame. A universal frame format was used for all the transmission of data within the
network. It is universal because the same format was used regardless of the device or sensor that
was generating the data.
Depending on the sensor, the frame was between 14 and 42 bytes long. The frame consisted of a start and end flag. This was so the receiving device knows when one frame is completely received. It also contained a unique device ID, which is also its address. It was this address that was used to identify the node/user to which the data belongs. There was also a sensor ID that is unique for each type. Following the sensor ID, the sensory data contains all the actual sensor data. The data format was specific to the sensor type.
As whole frame was generated whenever new sensor data was being transmitted, there was a unique sensor ID associated with every type of sensor in the network. Because the ID was 8 bits long, there could be a total of 256 sensors on each node. Though only two sensors were required, it is possible to add more, as well as have different sensors on different nodes. The nature of some sensors vary, thus the amount of data varied. To minimize frame length, the data length could be scaled from 4 to 32 bytes.